
Market Pulse: May 27, 2024
Excess, or not enough?
The San Francisco Fed is keeping track of the Pandemic-Era Excess Savings. A SF Fed publication on the matter explained that “pandemic-related fiscal support combined with a drop in household spending contributed to a sizable increase in household saving in the overall US economy. Aggregate personal savings rose rapidly, well above its pre-pandemic trend.”
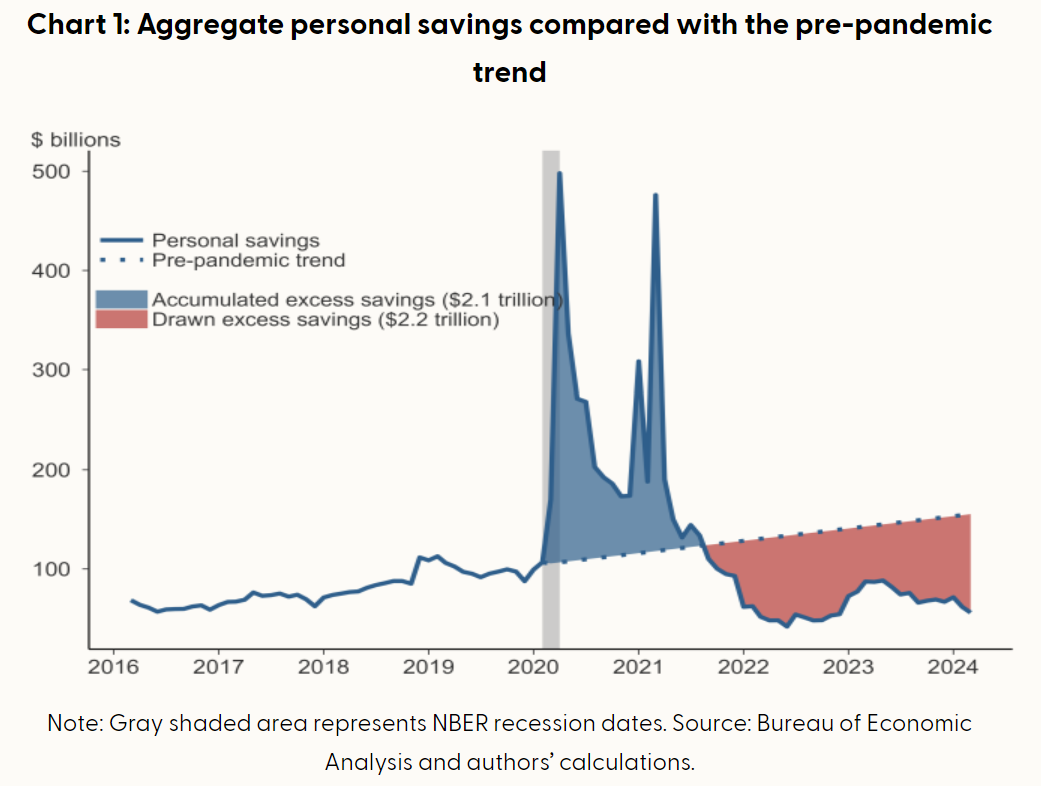
The first spike on the chart above was a combination of the sudden and drastic economic shutdown that prevented people from spending money, and in addition, the first wave of government support during a period of great uncertainty. The second spike in the opening months of 2021, was all down to the unprecedented government transfers to we the people. The spike in the savings rate was well above any previous experience; it is therefore described as “excess savings”. This measure of savings peaked in the months following the super-sized fiscal stimulus that was delivered in 2021,

Excess savings is “calculated as the accumulated difference in actual de-annualized personal savings and the trend implied by data for the 48 months leading up to the first month of the 2020 recession as defined by the National Bureau of Economic Research,” says the SF Fed. So, it can be said, the spike in savings was unusually large compared to everything that preceded it. But then, it was back to the mean for excess savings. The SF Fed figures “Households drew down their excess savings at an average pace of $70 billion per month since September 2021, although this drawdown accelerated to about $85 billion per month since last fall relative to the average pace for the entire period.”

In regards to consumer spending, I think it can be said that it is better to spend money you have instead of borrowing the money that you spend. I think it is interesting to note that the first spike in cumulative excess savings was in April 2020, which is also the first time the 12-month average for the monthly change in revolving credit (new credit card debt) fell below zero and that it wasn’t until July 2021, the penultimate month that excess credit expanded, that the 12-month average for credit card debt was once again positive. Credit card debt rose from there to record levels, during the time that excess savings was getting whittled down.

As can be seen on one of the charts above, as of March, the pandemic-era excess savings have lapsed; as of then the savings were -$72 billion, therefore below the established pre-covid trend. It might be important that in March the expansion of credit card debt fell to its lowest amount, $15.2 million (not billion), since it was last negative in April 2021.

Excess savings gone, that’s for sure. Credit card debt rolling over, could be.
What’s next for the consumer?