
Market Pulse: June 3, 2024
Sometimes things are not what they appear to be; first impressions can, on occasion, mislead. For instance, I don’t think the labor market is as good as the nonfarm payrolls make it seem. Why do I say that…go ask ALICE.

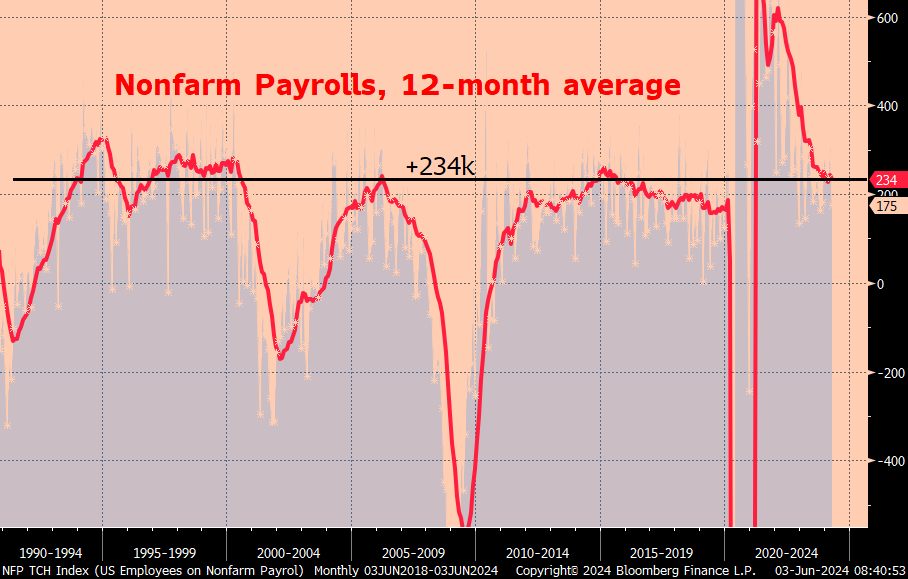
Nonfarm payrolls have been strong. The rate of increase is slowing, but, regardless, the 12-month average, at +234k, is historically notable. In the two decades from the turn of the century until the onset of the pandemic, the 12-month average for payroll gains was as high as it is now only seven percent of the time; in other words, not very often.
Why the frown? The University of Michigan reading of consumer sentiment is not impressed. Post pandemic strength in payrolls has been met by depressed sentiment readings. For instance, the 12-month average for UM sentiment is 70.8; in the last forty years this level was only breached during, and just after, the Great Financial Crisis.

Payrolls soared after the initial volatility seen in the spring and summer of 2020. The trend has been slowing, but as I noted above gains remain quite strong on a historical basis. Payroll gains have always been accompanied by a rise in sentiment. Often times, before the last few years, when sentiment begins to roll over it foreshadows trouble for job creation, and then, eventually, actual job losses follow sentiment lower. There was a rebound of sentiment when payrolls started to recover from the significant loss in the spring of 2020, but it didn’t last long. By mid-2022 sentiment was down at record lows, even though total payrolls soared to new all-time highs. Take note, this divergence is almost three years old, it’s more than a kink in the data.

In mid-May a Harris poll, done for The Guardian newspaper, found that “nearly three in five Americans wrongly believe the US is in an economic recession…55% believe the economy is shrinking, and 56% think the US is experiencing a recession…” The Guardian highlights these results as “misconceptions”, citing, for example, the fact that GDP has been growing, not declining. The paper also notes that while 49% of poll respondents believe that unemployment is at a 50-year high, the data says that the unemployment rate has been under 4%, near a 50-year low. In relation to what I am talking about in this essay, the Harris poll is certainly more aligned with the U of Michigan sentiment index than it is with nonfarm payrolls. Jobs data says “go, go, go” and sentiment says “no, no, no”. Who you gonna believe, sentiment or your own lyin’ eyes?
The federal government has different measures of poverty. Generally accepted is the Health and Human Services measure using the Federal Poverty Line (FPL). These guidelines say that a single person household is in poverty with annual income of $15,060, or less, per year and a family of four is in poverty at or below $31,200. The number of households at this measure has been at or around 16 million since 2010. The Census Bureau figures that this means 37.9 million individual people are below the poverty line, which at the end of 2022 meant 11.5% of the population. However, at the end of the day, the FPL is an estimate/guess/dart toss; especially because the cost of living in Philadelphia, PA is quite different from the cost of living in Philadelphia, MS. It is a safe bet that $31,200 goes a lot further in Mississippi than it does in Pennsylvania, and if that amount of money is the poverty level in the rural South, then what is the level for New York City/LA/Chicago/Seattle…etc? Rachel Wolfe of the Wall Street Journal wrote about this topic earlier this spring. “The share of households below the census designated federal poverty line has barely budged since 2010. Meanwhile, poverty researchers say a large and fast-growing group of people are earning too much to qualify for social services and not enough to afford the basics where they live. ‘We wonder why there’s so much anger in public discourse today, and it’s in part because of the stress people feel to just keep themselves and their families afloat,’ says Lisa Tepper Bates, president of the United Way of Connecticut. ‘People feel like the system is not serving them.’ United Way calls this population ALICE, or Asset Limited, Income Constrained, Employed. The organization says about 36 million American households, or 29%, met the criteria in 2021, the most recent year for which data is available. That’s up 18% from 2010. Preliminary data show the same trend continuing through 2022.” The WSJ uses Hartford, CT as an example of how widespread ALICE households have become. The cost of living in Hartford outpaces the national average, and therefore the definition of poverty does not accurately describe the state of affairs for many families that live there. As a result, the ALICE households account for 38% of all households in Hartford. That’s not good.
It is important to note the ALICE households are separate from the households that fall beneath the FPL. ALICE is above the poverty line. Also, by definition, at least one member of the home unit is employed; therefore, at least one member per household is part and parcel of the nonfarm payroll data. So, on a national basis there is 16 million households at or below FPL and another 36 million ALICE households, according to the United Way calculation; so, a total of 52 million households in these two categories. Remember, the Census Bureau figures that there were 37.9 million in people in poverty; about 2.5 times the number of households at or under FPL. Reasonable math since the average household size in the US is 2.5 people. How many more people live in ALICE households?!? If we take the estimated number of ALICE households and multiply by the average household size, the answer is 90 million. Therefore, it is plausible, the argument can be made, the results of the math believed or not, judged on a sliding scale dependent on how one views this data and these assumptions, that the total number of people in ALICE and FPL households is 128,000,000. Given that there are an estimated 128,000,000 people at ALICE or lower, and assuming the US population is about 335,000,000, then the percent of people in these categories is about 38% of the US. That’s not good. Population and demographic data are not high frequency stuff, so allow for fudge factors. But I think the story has not improved during this inflationary period because reports show that inflation bites harder on the ALICE household than it does the average household. Payroll data is strong. But sentiment is quite weak, which leads me to believe the labor market façade is hiding cracks in the foundation; it is not what it appears to be.
As I write this essay, literally as I wrote the sentence above, I heard a TV commentator say that most Americans think the country is in a recession, and then he opined, “I think that is mid-information.” His point being that people were being told times were bad, but that these people were not actually suffering through a tough situation. To him I say, go ask ALICE.